An important factor which makes it difficult to capture the power consumption of a wireless node in one number is the time the node is active and sending information.
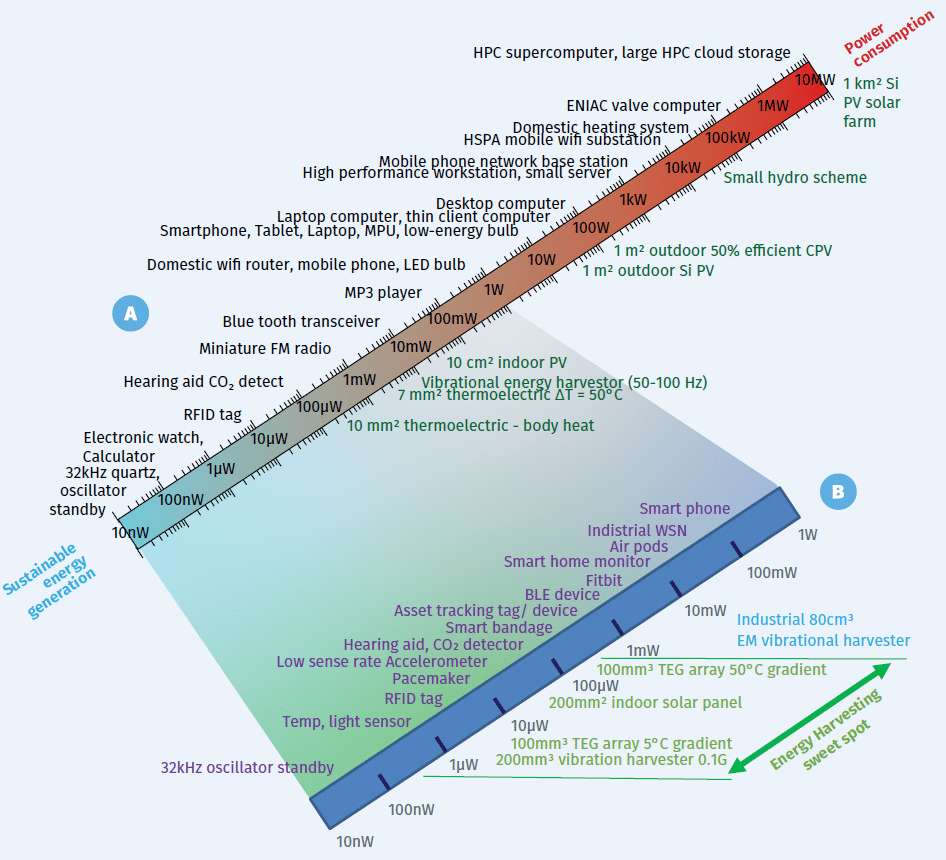
Thanks to Würth Electronik GmbH and Enables (EU funded research infrastructure project coordinated by Tyndall National Institute), who generated the graph attached. Please consider that the graph was generated more than 3 years ago and taking Moore’s Law into account you can divide the power consumption numbers by a factor of 2-4. In the meantime, also energy harvesters have become more efficient.
Area-A shows the typical power consumption of different ICT devices and systems whilst Area-B, shows IoT edge devices versus the power that can be generated from energy harvesters.
Another important factor which makes it difficult to capture the power consumption of a wireless node in one number is the time the node is active and sending information. If the operating cycle is low frequency there is more time to capture the ambient energy and store it until required clearly if the node is more frequently active there is less time to capture energy. Besides that, the data rate, distance and type of communication link (e.g., Zigbee, BLE, Wifi LoRA, NB-IoT etc.) already show a range between 150 uW to 400mW. Given this is what energy harvesters can generate, having the flexibility of using multiple harvesters of different kinds will contribute to the design of reliable autonomous wireless sensor nodes.


